On this page
"I can't hear anyone" is the whole bug report you usually get for a broken WebRTC call. Behind it could be a denied microphone permission, a signaling message that never arrived, a firewall eating UDP, or a laptop CPU so busy it stopped encoding video. The browser knows which. You just have to know where it writes it down.
Every major browser has that place, and they are all different. This is a practical tour of them, starting with the question that saves the most time.
WebRTC debug: find the failing layer first
WebRTC fails in four distinct places, and each has a signature you can spot in under a minute:
| Layer | What you see | Where to confirm |
|---|---|---|
| Devices | No local preview, permission prompt never appears | Browser console: NotAllowedError or NotFoundError from getUserMedia |
| Signaling | Nothing happens after joining, no remote peer at all | Network tab, WebSocket frames: did the offer and answer go both ways? |
| Connectivity (ICE) | Peer appears, connection state goes to failed | webrtc-internals: ICE candidate pairs, no pair succeeded |
| Media quality | Connected, but frozen, choppy or silent | webrtc-internals stats: bytes, packet loss, quality limitation |
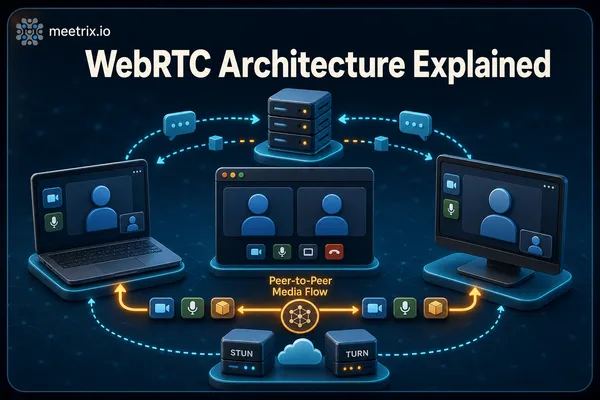
People skip this step and go straight to TURN configs. Don't. If the offer never reached the other side, no amount of ICE tuning helps, and a signaling server problem looks identical to a network problem from the user's chair. The WebRTC architecture overview is worth a skim if those four layers are not already familiar.
Chrome WebRTC internals
Open chrome://webrtc-internals in a new tab before starting the call. You can open it mid-call and still get live stats, but the event history from connection setup may be incomplete, and setup is usually where the bug is.
Each peer connection gets its own section. Read it in this order:
- The event log. Look for
setRemoteDescriptionfailures and foriceconnectionstatechangeending infailed. An error onaddIceCandidateusually means candidates arrived before the remote description, which is an ordering bug in your signaling code. - The candidate pairs. In the stats, find the pair marked as selected or nominated with state
succeeded. If none exists, ICE never found a working path. Check whether anyrelaycandidates were gathered at all; none means your TURN server is unreachable or rejected the credentials. - The RTP stats. These are the same numbers
getStats()returns in code. Oninbound-rtp, a flatbytesReceivedmeans media is not arriving. Rising bytes withframesDecodedstuck at zero means it arrives but can't be decoded. Onoutbound-rtp,qualityLimitationReasontells you outright whether the sender dropped resolution because ofcpuorbandwidth.
That last one ends a lot of arguments. When users complain the video is blurry, qualityLimitationReason: cpu means their machine is the bottleneck, not your server.
Read a WebRTC internals dump from a user
You rarely get to reproduce a customer's call on their network. Ask them to open webrtc-internals before the call, reproduce the problem, then click Create Dump and send you the downloaded file. Load it into webrtc-dump-importer, an open source tool that rebuilds the graphs from the JSON, and you are looking at their call as if you were there. For a quick verdict instead of graphs, drop the same file into our WebRTC internals analyzer for a plain-English report.
For camera and microphone capture problems specifically, chrome://media-internals shows the capture devices and their formats, which webrtc-internals does not. If the error happens before any connection exists, it is a device access problem, and getUserMedia errors and constraints is the better place to start. To rule out the camera, mic and network in one go, ask the user to run a pre-call check.
Firefox: about:webrtc
Firefox's version is about:webrtc. It shows each connection with its local and remote SDP, ICE candidates and candidate pairs, and RTP statistics. The layout differs from Chrome but the same three questions apply: did descriptions apply, did a candidate pair succeed, are bytes flowing.
It has one thing Chrome's page lacks: a button to save the whole page, which is an easy artifact to ask Firefox users to attach to a support ticket.
Safari WebRTC internals on Mac, iPhone and iPad
Safari is the awkward one, and it is also where a lot of real-world bugs live, because every browser on iOS uses the Safari engine. There is no webrtc-internals equivalent. Instead, Safari writes WebRTC activity into the Web Inspector console.
Turn on the Safari WebRTC log
On a Mac:
- Enable Show features for web developers (older versions: "Show Develop menu in menu bar") in Safari's Advanced settings.
- Open Web Inspector on the page, go to the console settings, and set WebRTC Logging to Verbose.
- Reproduce the call. At Verbose level the console includes periodic statistics, similar to calling
getStats()every couple of seconds.
For an iPhone or iPad, turn on Web Inspector under Settings, Safari, Advanced on the device, connect it to the Mac with a cable, then pick the device and page from Safari's Develop menu. The same console setting applies.
Verbose logging slows the inspector down
Testing a user's connection without test.webrtc.org
Browser tools need someone technical at the keyboard. For regular users you want a test page they can open themselves.
The old answer was Google's WebRTC Troubleshooter at test.webrtc.org. It no longer loads, and its GitHub project is marked as on hold. Hosted troubleshooters from that era, including the one we used to run, have mostly been retired too. What still works:
- Trickle ICE for checking STUN and TURN servers. Look for
relaycandidates, not just "Done". - A pre-call test inside your own app, which is the only thing that tests the user's real network against your real servers.
The most useful pre-call test is tiny. Force the connection to use only TURN, and see whether a relay candidate appears:
async function canReachTurn(turn) {
  const pc = new RTCPeerConnection({
    iceServers: [turn],            // { urls, username, credential }
    iceTransportPolicy: 'relay',   // ignore host and STUN candidates
  });
  pc.createDataChannel('probe');

  const found = new Promise((resolve) => {
    pc.onicecandidate = ({ candidate }) => {
      if (!candidate) resolve(false);             // gathering finished, nothing found
      else if (candidate.type === 'relay') resolve(true);
    };
    setTimeout(() => resolve(false), 8000);
  });

  await pc.setLocalDescription(await pc.createOffer());
  const ok = await found;
  pc.close();
  return ok;
}
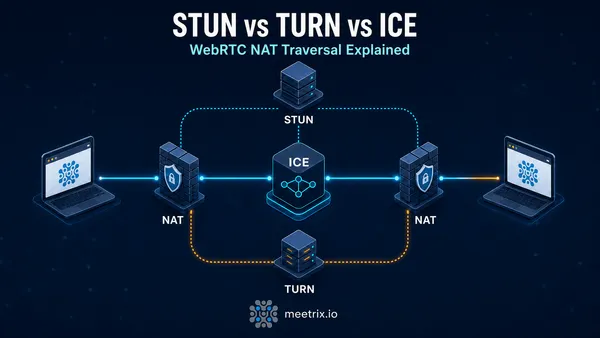
Run it with your TURN URL on UDP, then again with turns: on 5349 or 443. A user who fails UDP but passes TLS is behind a restrictive firewall, and now you know to make TLS TURN available rather than guessing. If you need a TURN server to test against, installing Coturn on Ubuntu covers it, and STUN vs TURN vs ICE explains why the relay test is the one that matters.
These tools help with one session at a time. To catch problems across all your users before they report them, set up production monitoring for WebRTC.
Running Jitsi Meet rather than your own WebRTC app? The same browser tools apply, but most failures there are server configuration, and Jitsi Meet common errors maps each error message to its cause.
Frequently Asked Questions
Does Safari have a WebRTC internals page?
No. Safari has no equivalent of chrome://webrtc-internals. Set WebRTC Logging to Verbose in the Web Inspector console settings, which prints connection events and periodic stats. For an iPhone or iPad, connect it to a Mac and inspect the page from the Develop menu.
How do I open WebRTC internals in Chrome?
Type chrome://webrtc-internals into the address bar of a new tab, ideally before the call starts so the setup events are captured. Edge uses edge://webrtc-internals with the same layout.
How do I read a webrtc-internals dump?
Click Create Dump on chrome://webrtc-internals while the call is running and save the JSON file. Load it into the open source webrtc-dump-importer tool, which rebuilds the stats graphs so you can read someone else's dump without reproducing the call yourself.
Is the WebRTC Troubleshooter at test.webrtc.org still available?
No. It no longer loads, and its GitHub project is on hold. Trickle ICE on webrtc.github.io still tests STUN and TURN, and a short in-app test with iceTransportPolicy set to relay tells you whether a user can reach your TURN server.
What is the Firefox equivalent of webrtc-internals?
about:webrtc. It lists each peer connection with its ICE candidates, candidate pairs, SDP and RTP statistics, and lets you save the page for later. Open it in a separate tab while the call runs.
Why does my WebRTC call connect but show no video?
Check bytesReceived on the inbound video stream in webrtc-internals. If it isn't increasing, media isn't arriving: a firewall, a missing TURN server, or a track never added. If bytes arrive but framesDecoded stays at zero, it is a codec or rendering problem.
Rule Out TURN in Minutes
A pre-configured Coturn TURN server on AWS, so the relay test above has something reliable to connect to.
Deploy Coturn from AWS Marketplace