
When a Jitsi call goes bad, users say "the video froze". That tells you nothing. Was the bridge overloaded, was the network saturated, or was it one participant on hotel Wi-Fi? Without numbers from the videobridge itself you are guessing.
We have run Jitsi Videobridge (JVB) monitoring on CloudWatch since 2020. This is the setup, including the mistake in our own first dashboards. (The same metrics also chart well in Grafana, if you already run a Grafana server on AWS.)
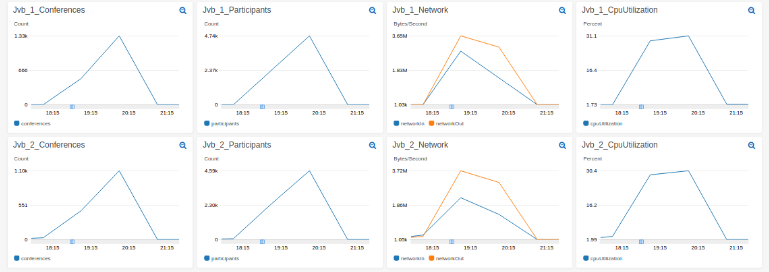
Which Jitsi video bridge metrics to watch
Two groups. Custom metrics come from the bridge software. System metrics come from EC2.
| Metric | Source | What it tells you |
|---|---|---|
stress_level | JVB | Overall bridge load. Around 1.0 means full; the best alarm and scaling signal. |
participants | JVB | People connected to this bridge right now |
conferences | JVB | Active meetings on this bridge |
bit_rate_upload / bit_rate_download | JVB | Media bandwidth, in kbps |
largest_conference | JVB | Size of the biggest meeting; spots the one huge call |
| CPUUtilization | EC2 | Processing load |
| NetworkOut | EC2 | Bytes sent. Usually the first thing to run out, and what you pay for. |
| Memory | CloudWatch agent | Not reported by EC2 without the agent |
Reading the stats from the videobridge
The bridge exposes its numbers on a private HTTP port, 8080 by default, documented in the JVB statistics reference. Query it on the bridge itself:
# Prometheus metrics, enabled by default
curl -s http://localhost:8080/metrics -H 'Accept: application/json' | head

# JSON stats, needs the REST interface enabled in jvb.conf
curl -s http://localhost:8080/colibri/stats | jq '{participants, conferences, stress_level}'
If /colibri/stats returns 404, enable the REST API in /etc/jitsi/videobridge/jvb.conf with videobridge.apis.rest.enabled = true and restart the bridge. Keep port 8080 closed in the security group. It is for local use only.
Publishing JVB metrics to CloudWatch
Option 1: a small script and cron
The simplest thing that works. Give the instance an IAM role with cloudwatch:PutMetricData, then run this every minute:
#!/bin/bash
# /usr/local/bin/jvb-metrics.sh
STATS=$(curl -s http://localhost:8080/colibri/stats)
TOKEN=$(curl -s -X PUT http://169.254.169.254/latest/api/token -H "X-aws-ec2-metadata-token-ttl-seconds: 60")
ID=$(curl -s -H "X-aws-ec2-metadata-token: $TOKEN" http://169.254.169.254/latest/meta-data/instance-id)

for M in participants conferences stress_level largest_conference; do
  V=$(echo "$STATS" | jq ".$M")
  aws cloudwatch put-metric-data --namespace Jitsi/JVB \
    --metric-name "$M" --value "$V" --dimensions InstanceId="$ID"
done
# crontab -e
* * * * * /usr/local/bin/jvb-metrics.shAdd an AutoScalingGroupName dimension as well if the bridges scale, so you can alarm on the whole group instead of one instance that may be gone tomorrow.
Option 2: the CloudWatch agent
The CloudWatch agent is worth installing anyway, because it is the only way to get memory and disk usage. It can also scrape Prometheus endpoints, which means it can read the bridge's /metrics directly without a script. More setup, but no cron job to forget about.
Custom metrics cost money per metric per month, so publish the handful you use, not all of them.
Graphs that tell the truth
Here is the mistake from our first dashboards. Look at the participant count on this bridge:
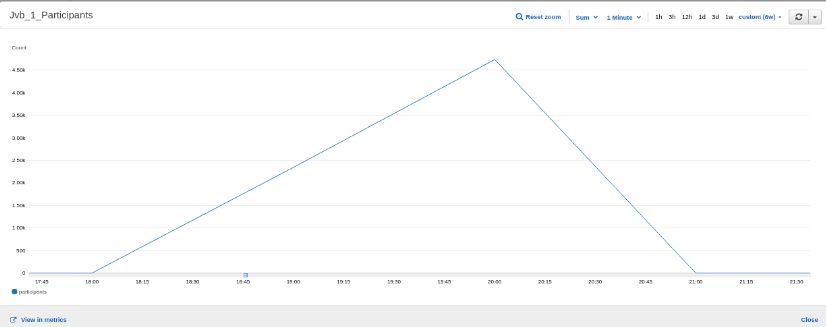
4,700 participants on one bridge? No. The graph uses the Sum statistic. Whenever the count is published more than once in a period, Sum adds all those readings together instead of showing how many people were actually connected. For counts like participants and conferences, switch the statistic to Maximum (or Average). Sum is only right for counters that measure events, such as bytes sent.
Line up the graphs
Alarms worth setting
- stress_level above 0.8 for 5 minutes: the bridge is close to full. This is also the signal to scale out on.
- No data for 5 minutes: the bridge or the script died. Treat missing data as breaching.
- NetworkOut far above normal: a huge meeting, or a misconfigured client, and a bigger bill.
- A bridge with zero conferences for a long time while others are busy: it has probably lost its connection to Jicofo and is running for nothing.
These alarms cover the bridge only. For the user side as well (client packet loss, failed connections and relay share), see our guide to monitoring WebRTC in production.
Once these metrics exist, the same numbers can drive autoscaling; see Jitsi scaling on AWS and our Terraform scripts for JVB and Jibri autoscaling. To find a bridge's real limits before production traffic does, run a Jitsi load test while you watch this dashboard. For a broader view than CloudWatch, Grafana can read these Prometheus metrics directly.
Frequently Asked Questions
How do I get statistics from the Jitsi Videobridge?
The bridge serves Prometheus metrics at /metrics on its private HTTP port, 8080 by default, and JSON statistics at /colibri/stats when its REST interface is enabled. Query them locally on the bridge; don't expose port 8080 to the internet.
Which Jitsi Videobridge metrics matter most?
stress_level for overall load, participants and conferences for usage, bit_rate_upload and bit_rate_download for bandwidth, and the instance's CPU and NetworkOut. stress_level is the best single number for alarms and autoscaling.
Why does CloudWatch show thousands of participants on my bridge?
The graph is using the Sum statistic. If a script publishes the participant count every few seconds, Sum adds all of those values in each period. Use Maximum or Average for counts like participants and conferences.
Does CloudWatch show memory usage for EC2 by default?
No. EC2 reports CPU, network and disk operations, but memory is only visible from inside the instance. Install the CloudWatch agent to publish memory, or publish the JVM's memory from the bridge's own metrics.
Can I autoscale Jitsi videobridges on these metrics?
Yes. Publish stress_level as a custom metric and use it in a target tracking or step scaling policy on the bridges' Auto Scaling group. It reflects bridge load better than CPU alone.