
Grafana on AWS
An AMI on AWS Marketplace, launched into your own AWS account with a CloudFormation stack.
- Deploys with
- CloudFormation
- Recommended size
- t3.small
- Ready in
- 5-10 minutes
Setup guides
Launch on AWS Run Grafana, the open-source observability platform, from a pre-configured AMI in your own AWS account. Build real-time dashboards and alerts across metrics, logs and traces while keeping full control of your data.
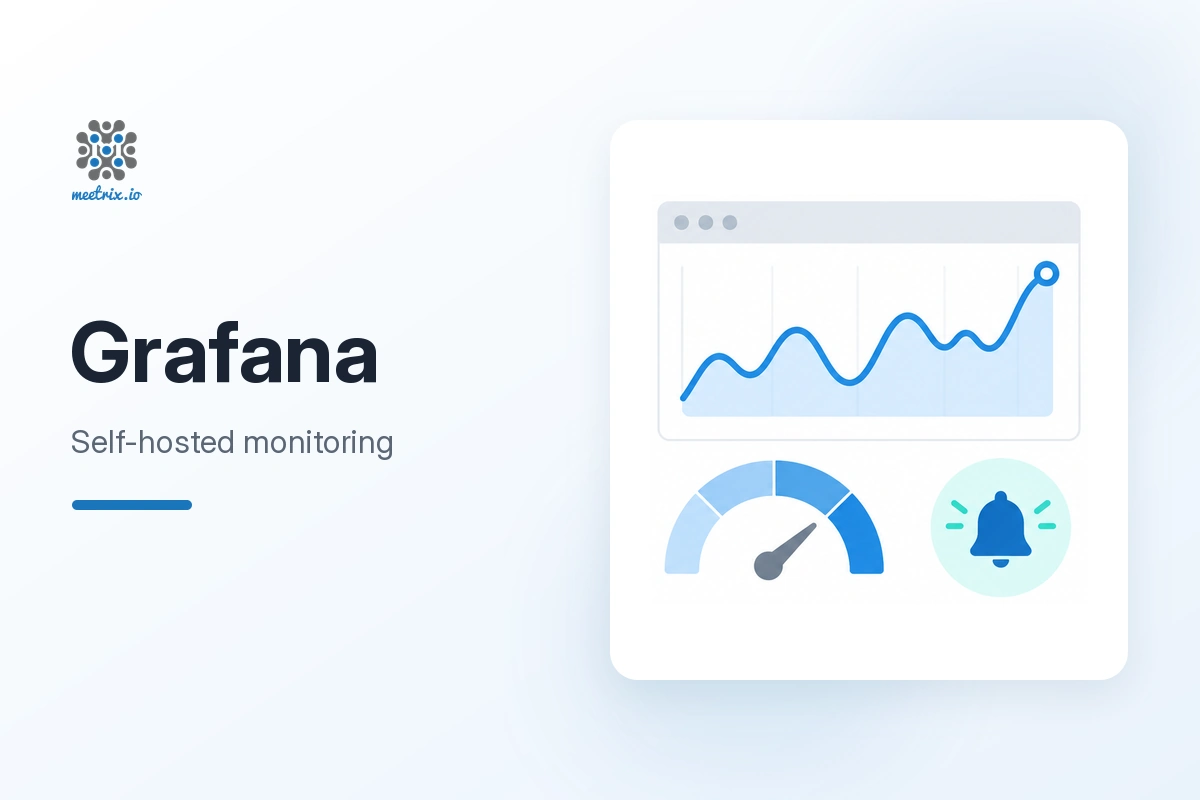
Grafana is an AGPLv3 observability and analytics platform. It is a dashboard layer that is not tied to one backend: it connects to Prometheus, Loki, CloudWatch, InfluxDB, Elasticsearch and many more, so you can see everything in one place.
Visualise metrics, logs and traces side by side.
Prometheus, CloudWatch, InfluxDB, Loki, PostgreSQL, MySQL and more.
Get notified when metrics cross your thresholds.
Extend Grafana with panels and data source plugins.
Invite team members and control their access.
Show KPIs straight from your application databases.
The AMI ships Grafana ready to sign in, with HTTPS set up at launch.
Subscribe on AWS Marketplace and launch the CloudFormation stack with your domain and admin email.
After 5-10 minutes, create a DNS record with the PublicIp from the stack outputs.
Open the DashboardUrl, log in with admin / admin and set a strong new password when prompted.
Connect Prometheus, CloudWatch or your databases and build your first dashboard.
An AMI on AWS Marketplace, launched into your own AWS account with a CloudFormation stack.
Launch on AWS | Grafana | Kibana | |
|---|---|---|
| Licence | AGPLv3 | SSPL, Elastic License v2 or AGPLv3 |
| Data sources | Dozens, from one dashboard tool | Elasticsearch only |
| Best at | Cross-source dashboards and metrics | Full-text log search |
| Common open-source pairing | Prometheus and Loki | The Elastic Stack |
Already committed to Elasticsearch for logs? Kibana may fit better. Read Grafana vs Kibana →
admin / admin. Grafana makes you set a new, strong password on the first login.
Yes. Grafana supports Prometheus, CloudWatch, InfluxDB, Loki and many more, configured from Data Sources in the admin panel.
Grafana is open source under AGPLv3. On AWS you pay for the instance and any Meetrix software fee shown on the listing.
Grafana for dashboards across many data sources and for metrics. Kibana for full-text log search on Elasticsearch.
No. Elasticsearch is just one of many data sources Grafana can use.
t3.small is the recommended starting point.
Back up your server data, remove the old stack and launch the new version from AWS Marketplace.
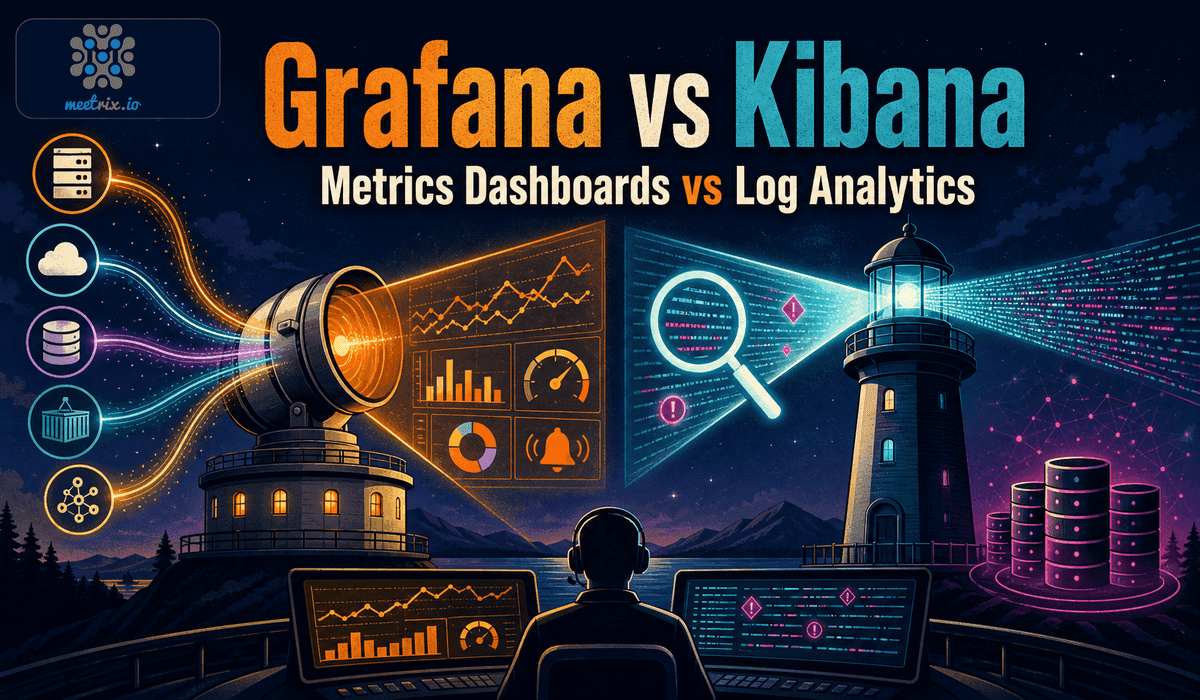
Data-source-agnostic dashboards against Elasticsearch's dedicated UI.
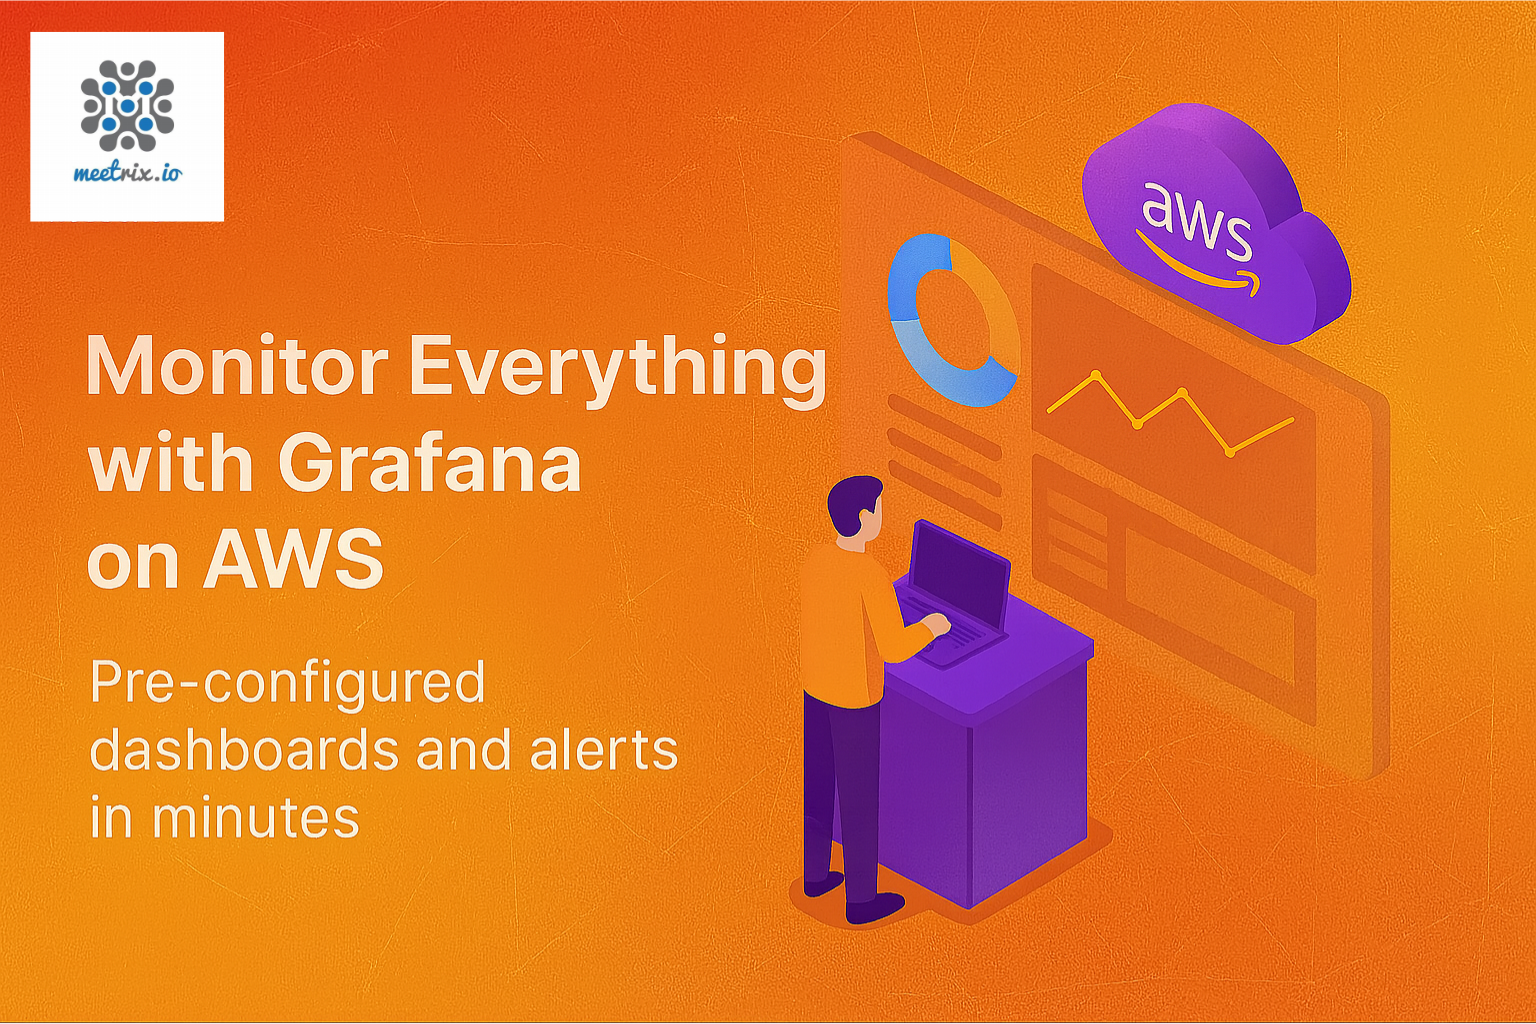
A pre-configured dashboard AMI and popular use cases.
Launch the stack, secure the admin account and set up SSL.
We build and run self-hosted monitoring stacks every day, from Prometheus to alerting. Tell us what you need.
Contact us