Launch Grafana on AWS with Meetrix - Pre-Configured Dashboard AMI for Instant Monitoring and Insights
Deploy fully configured Grafana in minutes with secure setup, seamless integration, and 24/7 expert support
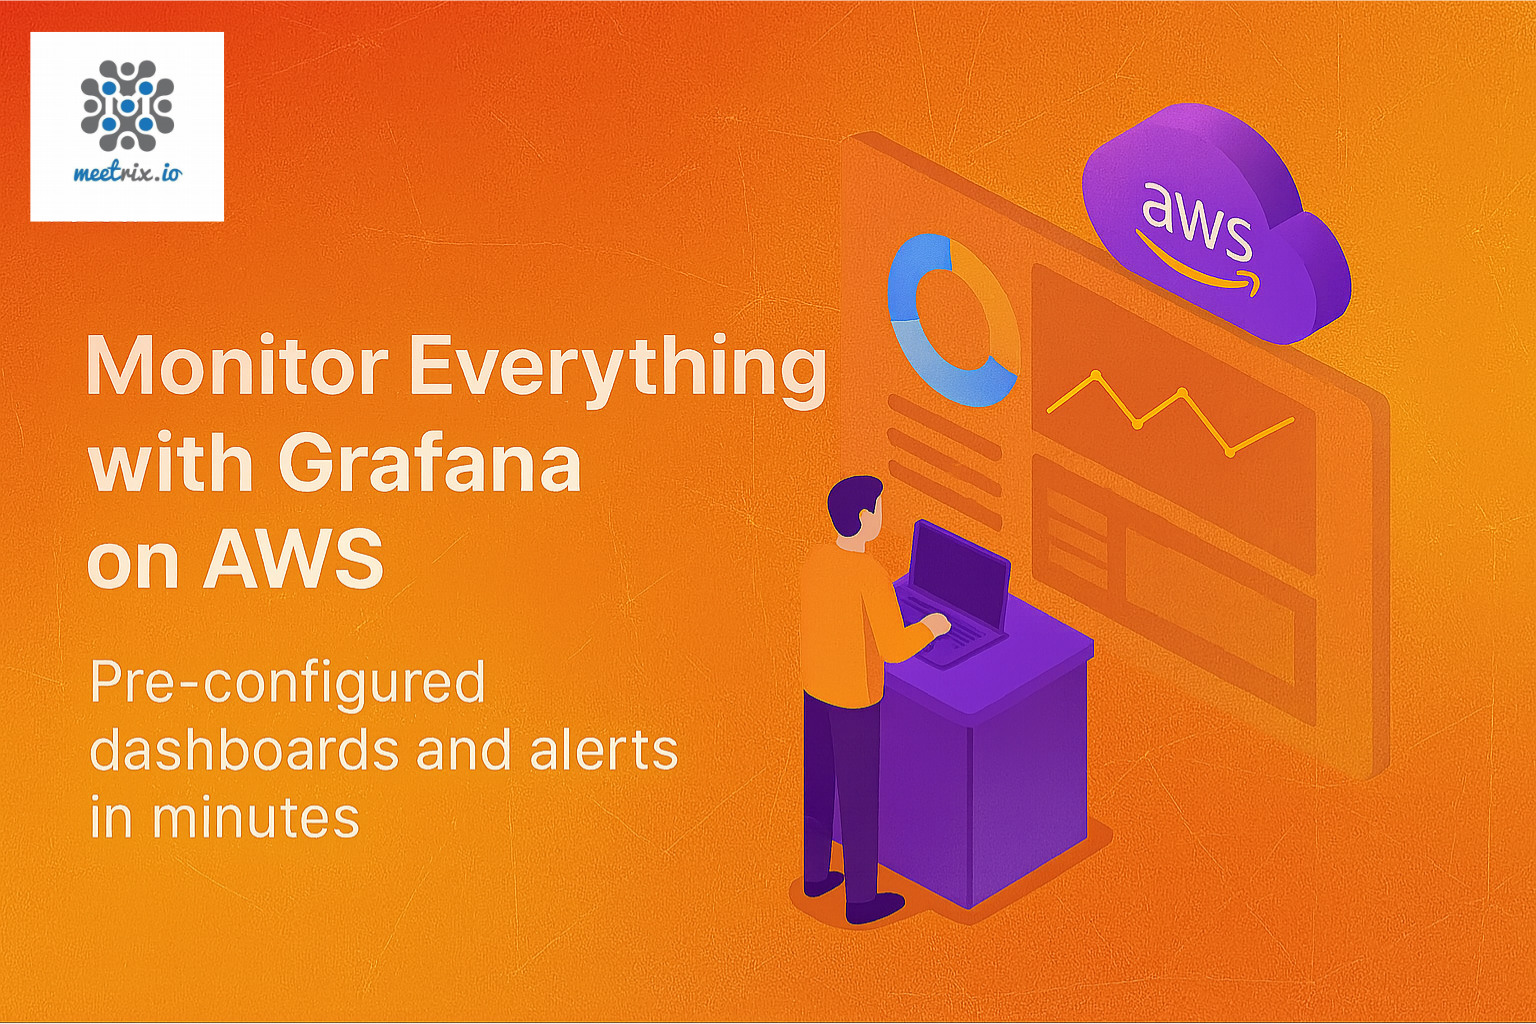
In today’s data-driven world, real-time visibility into your infrastructure, applications, and services is essential. Whether you're monitoring servers, Kubernetes clusters, cloud services, or business KPIs, Grafana is the go-to solution trusted by millions of developers, SREs, and enterprises worldwide.
With the Meetrix Grafana AMI, you can deploy a production-ready Grafana dashboard server in your AWS account in just a few clicks, optimized for speed, security, and scale.
What Is Grafana?
Grafana is an open-source analytics and visualization platform that turns metrics, logs, and traces into powerful, interactive dashboards.
Core Features:
- Custom dashboards for real-time monitoring
- Support for Prometheus, Loki, InfluxDB, Elasticsearch, PostgreSQL, and more
- Alerting and notification integrations (Slack, PagerDuty, email)
- Role-based access controls (RBAC) and secure sharing
- Plugin ecosystem for data sources, panels, and themes
- Multi-tenant support for enterprise-grade environments
Grafana gives you one unified window into your system health, performance, and reliability in a way that’s clear, flexible, and powerful.
Why Use the Meetrix Grafana AMI?
While Grafana is open source and easy to download, setting it up properly in a secure, scalable AWS environment can be time-consuming. You’ll need to handle server provisioning, user authentication, SSL certificates, firewall rules, data source integrations, and ongoing maintenance.
The Meetrix Grafana AMI eliminates all of that complexity.
Included in the Meetrix AMI:
- Latest stable Grafana version, fully installed
- NGINX reverse proxy with SSL enabled
- Pre-configured IAM roles and security groups
- Optional setup for Prometheus, Loki, or custom data sources
- System-level hardening for production use
- 24/7 expert support and consulting services
Who Should Use This?
This AMI is ideal for:
- DevOps and SRE teams needing unified monitoring tools
- IT operations teams managing distributed systems or multi-cloud environments
- Engineering leads who want real-time visibility into app and service health
- Startups and enterprises that need scalable, secure dashboards
- Agencies or MSPs who deploy Grafana for multiple clients
Popular Use Cases
Benefits of Meetrix's Grafana AMI
Frequently Asked Questions
Can I add my own data sources?
Yes. Grafana supports dozens of data sources natively, and Meetrix can assist with pre-wiring them into your deployment.
Is this secure for enterprise use?
Yes. Our AMI includes hardened server configuration, HTTPS, and strict IAM access policies.
Does this include alerting features?
Yes. Grafana’s alerting system is fully available, and we can help configure integrations like Slack, Opsgenie, and PagerDuty.Can I deploy this in a private subnet?
Yes. The AMI is VPC-ready and works in both public and private network setups
Monitor Everything, Anywhere with Grafana by Meetrix on AWS
Grafana gives you the power to visualize and analyze your data in real time. With Meetrix’s Grafana Dashboard AMI, you can skip the hassle of setup and go straight to building beautiful, actionable dashboards, secured, supported, and deployed in minutes.
Whether you're a startup building your first DevOps stack or an enterprise needing high-availability observability, Meetrix helps you deploy Grafana faster and smarter.
Launch your Grafana monitoring stack on AWS with Meetrix, and take control of your infrastructure visibility.
Get Started with Grafana AMI by Meetrix on AWS Marketplace